
Most articles on this subject open with a scary number and stop there. I want to do the opposite, because what the data actually shows is more specific — and more useful when you're deciding whether to spend $12,000 — than "outages are getting worse."
I've watched the pattern change over twenty years in this business. The calls I get after a storm are not more frequent than they were. They last longer.
The headline figure
According to the U.S. Energy Information Administration, electricity customers averaged about 11 hours of power interruption in 2024 — roughly double the typical figure for the preceding decade and the highest in ten years.
The driver was specific: hurricanes accounted for approximately 80% of those hours. 2024 brought Beryl, Debby, Helene and Milton, and the effect on the annual average is unmistakable.
South Carolina averaged about 53 hours — the highest of any state — in the aftermath of Helene, an inland-flooding and wind event that devastated infrastructure well away from the coast.
How the metrics work
Two industry indices, defined in IEEE 1366, do most of the work here, and knowing the difference explains what's actually happening:
SAIDI — System Average Interruption Duration Index. Total minutes of interruption divided by number of customers. Essentially: how long was the average customer without power this year?
SAIFI — System Average Interruption Frequency Index. Interruptions divided by customers. Essentially: how many times did the average customer lose power?
Utilities report both with and without "major event days" — a statistical carve-out for exceptional weather. The with-major-events figures are the ones that describe your actual experience; the without-major-events figures describe day-to-day system health.
The pattern in the data is clear: frequency has been relatively stable while duration spikes in major-event years. You are not losing power more often than your parents did. When you do lose it, it stays out longer, because the events causing it are larger and the damage is more extensive.
Why the average misleads
Here's the thing that matters most for a homeowner's decision, and it's the thing the headline number obscures.
The distribution is extremely skewed. Most outages are short — minutes to a couple of hours, from a tree branch, an animal, a vehicle strike, or a routine fault that reclosers handle. A small number of severe-weather events produce nearly all of the hours.
So "11 hours a year" doesn't describe anybody's year. What it describes is a population where most people had two or three brief interruptions, and some people in South Carolina, Georgia, Florida and Texas were out for a week.
That's why you buy backup power for the tail, not the mean. Nobody installs a $12,000 standby system to avoid a forty-minute flicker. They install it because a five-day outage in August or January is genuinely serious — and because that event is unpredictable, regionally concentrated, and increasingly the shape that outages take.
Where it's worst
Risk is not distributed evenly, and the drivers are geographic:
| Region | Primary driver | Character of outages |
|---|---|---|
| Gulf Coast, Southeast Atlantic | Hurricanes, tropical storms | Rare but very long — days to weeks |
| Texas | Hurricanes, winter events, grid stress | Both long storm outages and load-shed events |
| Northeast, Upper Midwest | Ice storms, nor'easters, heavy snow | Long duration, cold-weather stakes |
| California, Oregon, Washington | Wildfire and Public Safety Power Shutoffs | Planned, sometimes multi-day, increasingly common |
| Plains, Midwest | Tornadoes, derechos, thunderstorm wind | Sudden, localized, occasionally very long |
| Rural everywhere | Long radial distribution lines, low customer density | Longer restoration — you're last in the queue |
| Dense urban with underground service | Fewer weather-driven faults | Shortest and least frequent |
The rural factor deserves emphasis. Restoration crews work from the substation outward, prioritizing the circuits that restore the most customers per repair. A house at the end of a ten-mile radial feeder serving forty customers is, by design and by arithmetic, near the end of the list. Add a well pump — no power means no water — and the case for backup changes character entirely. See powering well pumps.
Why duration is increasing
Four factors, all documented and all pointing the same direction:
1. More billion-dollar weather disasters. NOAA's billion-dollar disaster record shows a marked increase in frequency of high-cost weather events over recent decades. Bigger events mean more infrastructure damage and longer restoration.
2. Aging distribution infrastructure. Much of the U.S. distribution system was built decades ago. Utilities are investing heavily in hardening and undergrounding, but it's slow and expensive work across millions of circuit miles.
3. Vegetation and overhead exposure. The overwhelming majority of U.S. distribution is overhead. Trees remain the leading cause of weather-related outages, and vegetation management budgets compete with everything else.
4. Planned shutoffs. Public Safety Power Shutoffs in fire-prone regions are a genuinely new category — deliberate multi-day de-energizations that didn't exist as a routine practice fifteen years ago. They're a wildfire-prevention success and an outage-duration increase at the same time.
What an outage actually costs a household
The abstract case for backup power becomes concrete quickly:
Food. USDA guidance is direct: a refrigerator holds safe temperature about 4 hours unopened; a full freezer about 48 hours, half-full about 24. A well-stocked freezer represents several hundred dollars, and the rule is "when in doubt, throw it out."
Frozen pipes. The expensive one. A winter outage that drops indoor temperature below freezing can burst pipes, and water damage from a burst line routinely runs into five figures — often far more than the generator.
Sump pump failure. A basement outage during the storm that caused the outage. Water damage, ruined finishes, mold remediation.
Medical equipment. CPAP, oxygen concentrators, home dialysis, refrigerated medications, powered mobility. For these households the calculation isn't financial.
Well water. No power, no pump, no water — for drinking, cooking, or flushing.
Work. Remote work stops. For a household where someone works from home, a multi-day outage is lost income.
Displacement. Hotels during a regional outage are expensive, full, or both.
Heat and cold. A modern gas furnace needs electricity for its blower and controls. Losing power in January means losing heat, even with a full gas supply.
What this means for your decision
Three practical conclusions from the data:
1. Look at your region and your circuit, not the national average. Your utility publishes reliability data, and your neighbors have direct experience. A national figure of 11 hours tells you nothing about a specific house at the end of a rural feeder in ice country.
2. Plan for the tail. The question isn't "how many hours per year." It's "what happens to this household on day four?" That's what determines fuel choice, tank size and whether partial coverage is acceptable. Natural gas never runs out; a 120-gallon propane tank is about 38 hours. See gas vs propane vs diesel.
3. Match the solution to the risk. Not every household needs whole-home standby. A battery covers the short outages that make up most events. A portable with a proper interlock covers essentials. Whole-home standby is for households where a multi-day outage is genuinely serious — medical needs, well water, deep freezes, remote work, or a region where week-long outages actually happen. Generator types compared.
The honest framing
Power outages are not a crisis for most American households most of the time. The typical year involves a few short interruptions that a flashlight handles.
What the data shows is that the severe end is getting more severe. The average is rising because major weather events are producing longer restorations, and the regions exposed to those events are experiencing genuinely disruptive multi-day outages with increasing regularity.
If you live in one of those regions — or if your household has a well, medical equipment, a finished basement with a sump, or a job that requires power — then backup power is a reasonable response to a documented risk, not an overreaction.
If you're in a dense metro with underground service, brief outages, and no special needs, a good flashlight and a phone battery pack are a proportionate response, and you should feel fine about that.
The data supports being specific about which one you are.
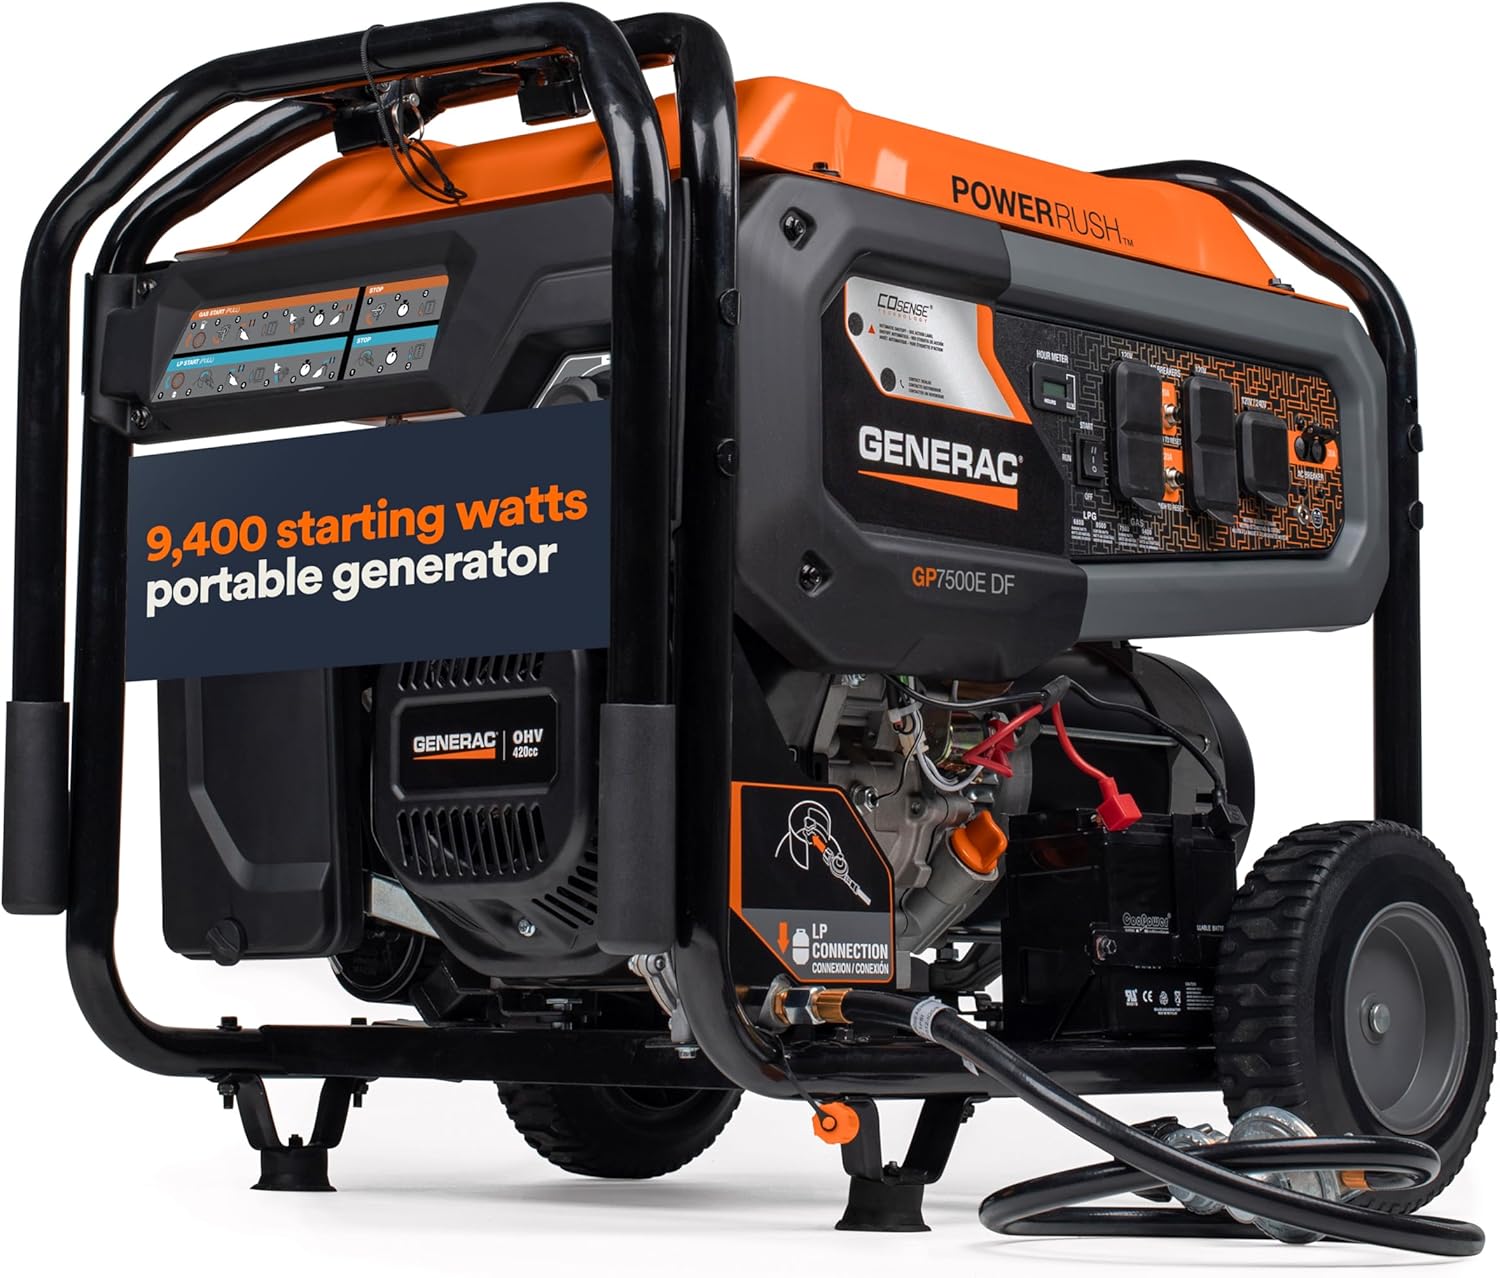
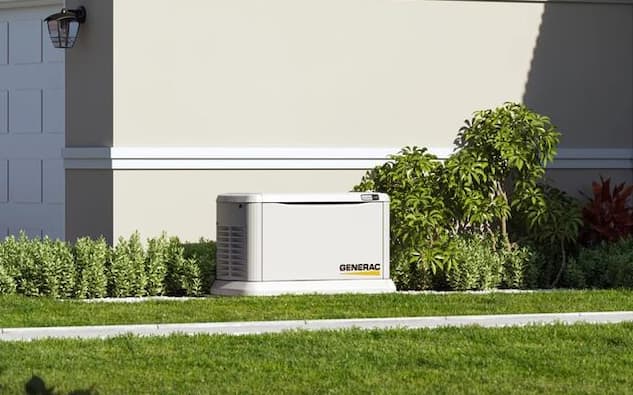
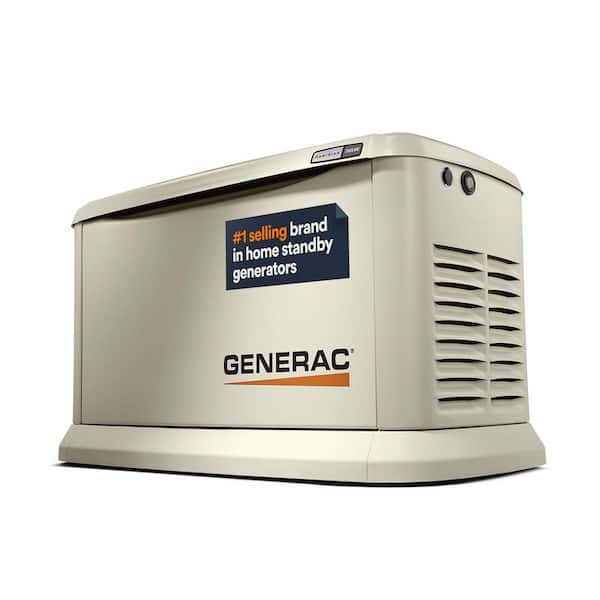
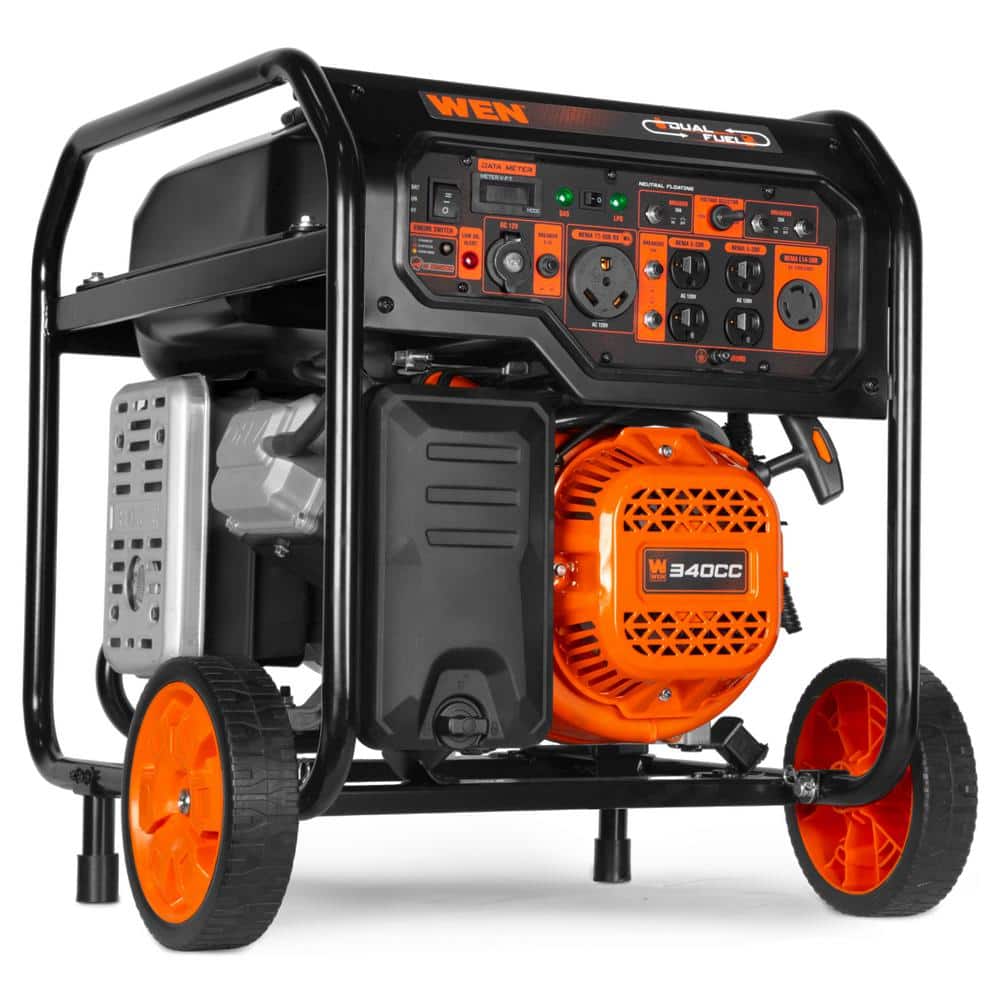
Backup options by outage profileAd
Whole-home standby for long events, a smaller unit for essentials, a dual-fuel portable, and a tank monitor.
Paid links · As an Amazon Associate, GenDealers earns from qualifying purchases.